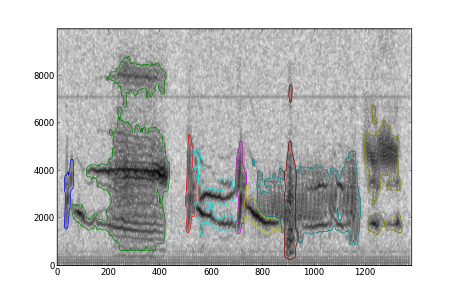
Contour plots are useful for visualizing 2D arrays of numbers where the values vary relatively smoothly over space. A less common use is to annotate regions in a plot, in which case the identity of each region is typically coded by an integer. If you have multiple regions, the values aren't going to vary smoothly, and the built-in matplot contour command won't look quite right: higher-valued regions will have multiple borders around them. The solution is to make a separate plot call for each unique value of the label. An optional gaussian filter can be used to smooth off region edges.
import numpy as nx

def dcontour(ax, *args, **kwargs):

    """

    Discrete contour function. Given a matrix I with a discrete number

    of unique levels, plots a contour at each unique level. Values less than 0

    are ignored.


    DCONTOUR(axes, I) plots the unique levels in I

    DCONTOUR(axes, X,Y,I) - X,Y specify the (x,y) coordinates of the points in I


    Optional arguments:


    smooth - specify a float or 2-ple of floats, which are used to gaussian filter

             each data level prior to contouring (which gives smoother contour lines)


    Other keyword arguments are passed to contour()

    """

    from scipy.ndimage import gaussian_filter


    smooth = kwargs.get('smooth', None)


    I = args[0]

    if len(args) > 1:

        (X, Y) = args[1:3]

    else:

        (Y, X) = (nx.arange(I.shape[0]), nx.arange(I.shape[1]))


    labels = nx.unique(I[I>-1])


    h = []


    kwargs['hold'] = 1

    for i in labels:

        if smooth!=None:

            data = gaussian_filter((I==i).astype('d'), smooth)

        else:

            data = I==i

        hh = ax.contour(X, Y, data,1, colors=colorcycle(i), **kwargs)

        h.append(hh)


    return h
The following code, or something equivalent, is necessary to ensure that the contour colors cycle through different values for each level. I find these particular colors pleasing and fairly easy to distinguish, but your mileage may vary, especially if you need to annotate more than 15 different regions.
_manycolors = ['b','g','r','#00eeee','m','y',

               'teal',  'maroon', 'olive', 'orange', 'steelblue', 'darkviolet',

               'burlywood','darkgreen','sienna','crimson',

               ]


def colorcycle(ind=None, colors=_manycolors):

    """

    Returns the color cycle, or a color cycle, for manually advancing

    line colors.

    """

    return colors[ind % len(colors)] if ind!=None else colors